Raymon Bosquillos
Graphic Designer
ABOUT
Retirement Lifestyles and Investment NeededInfographics Design for SEO/Digital PR
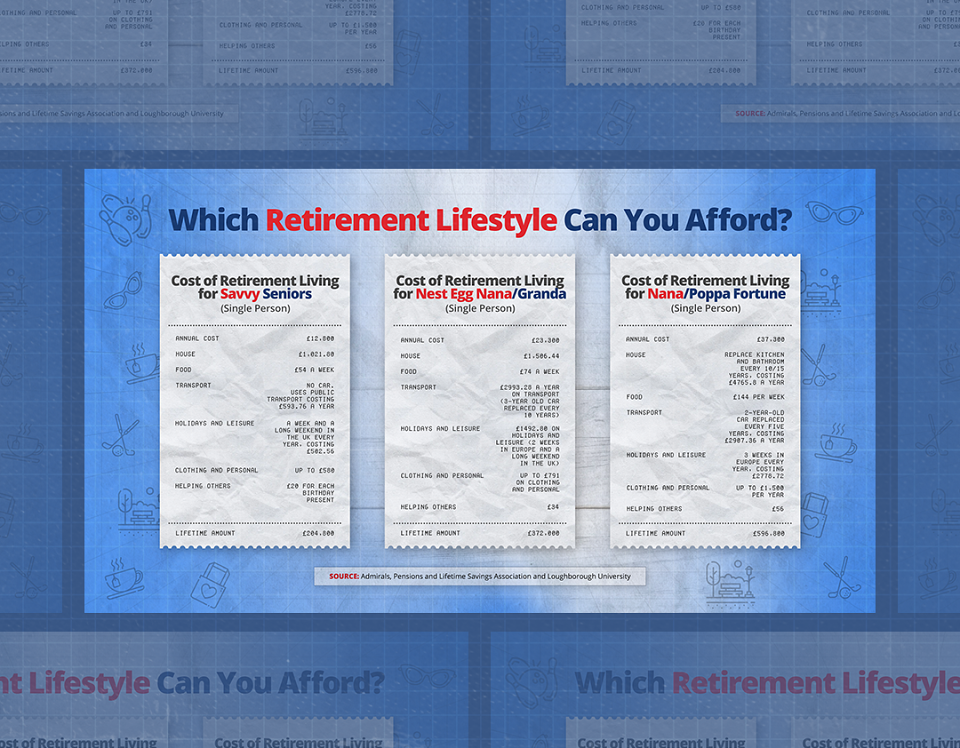
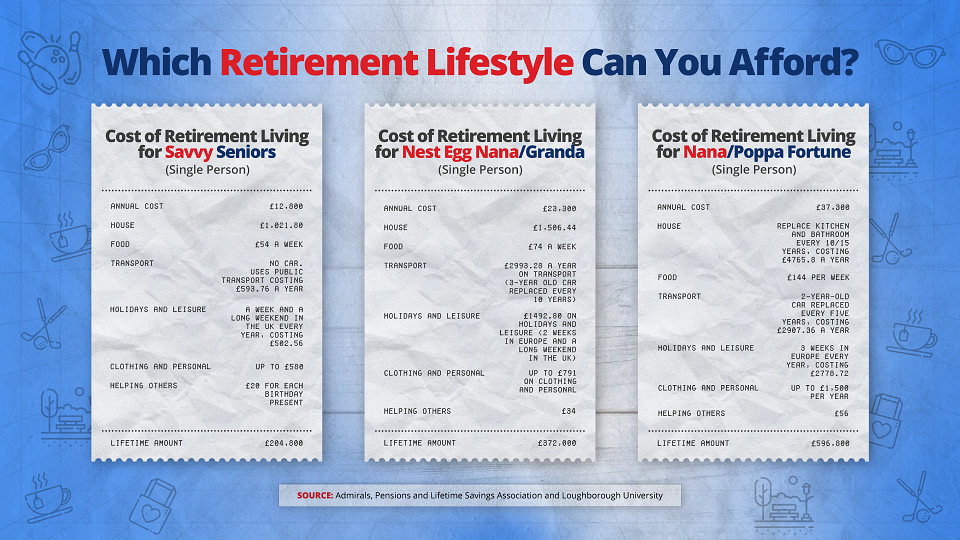
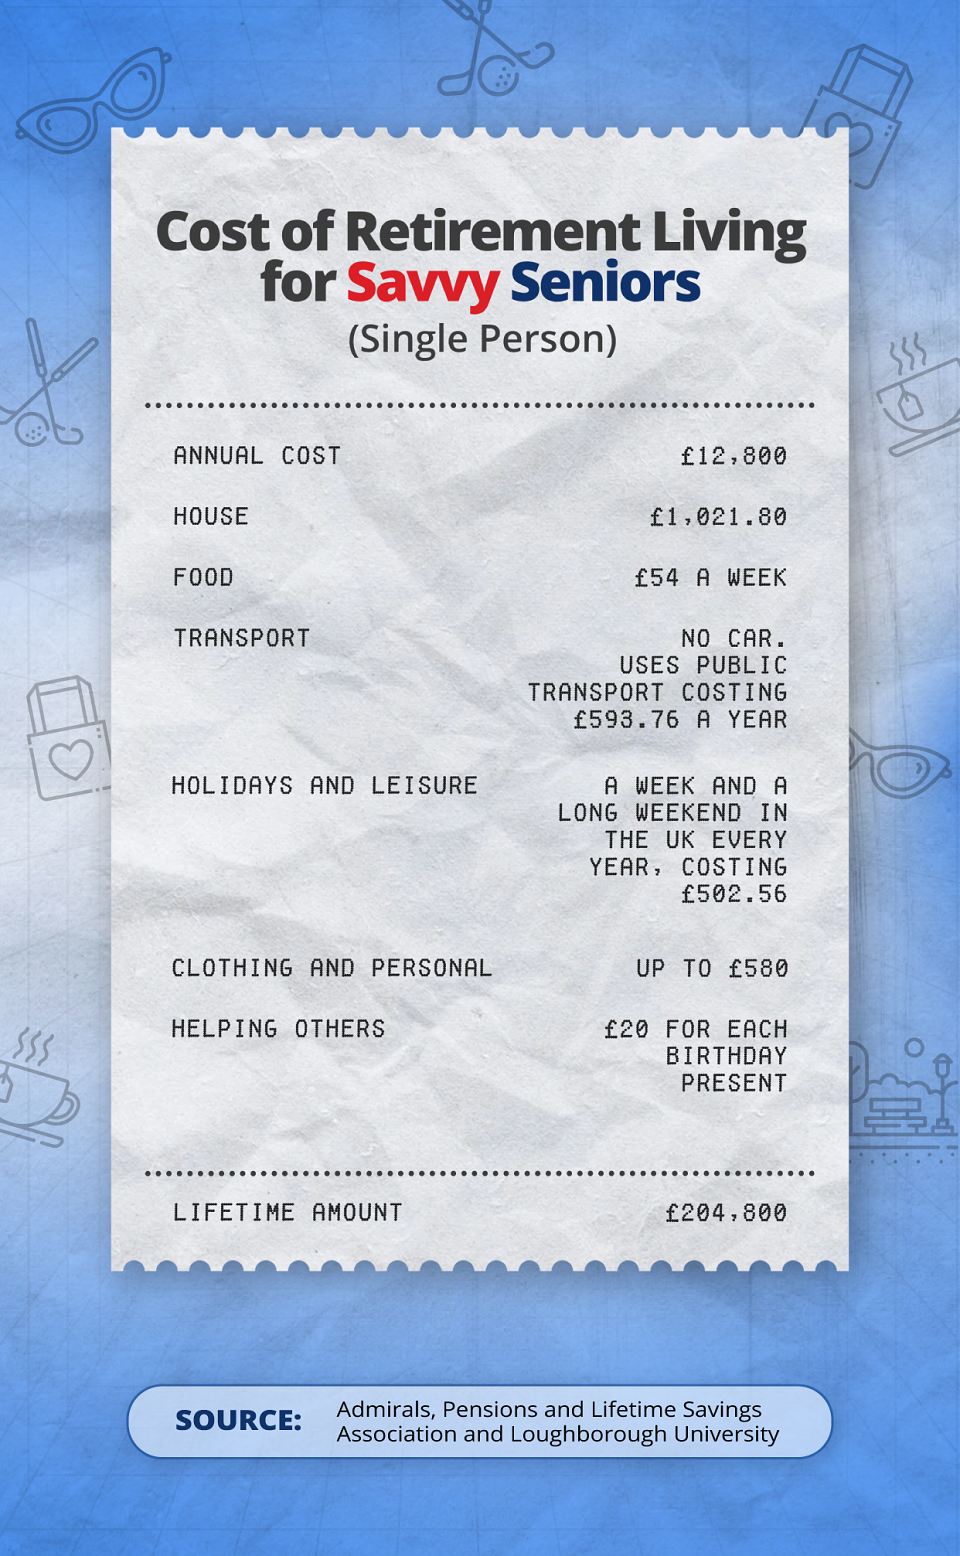
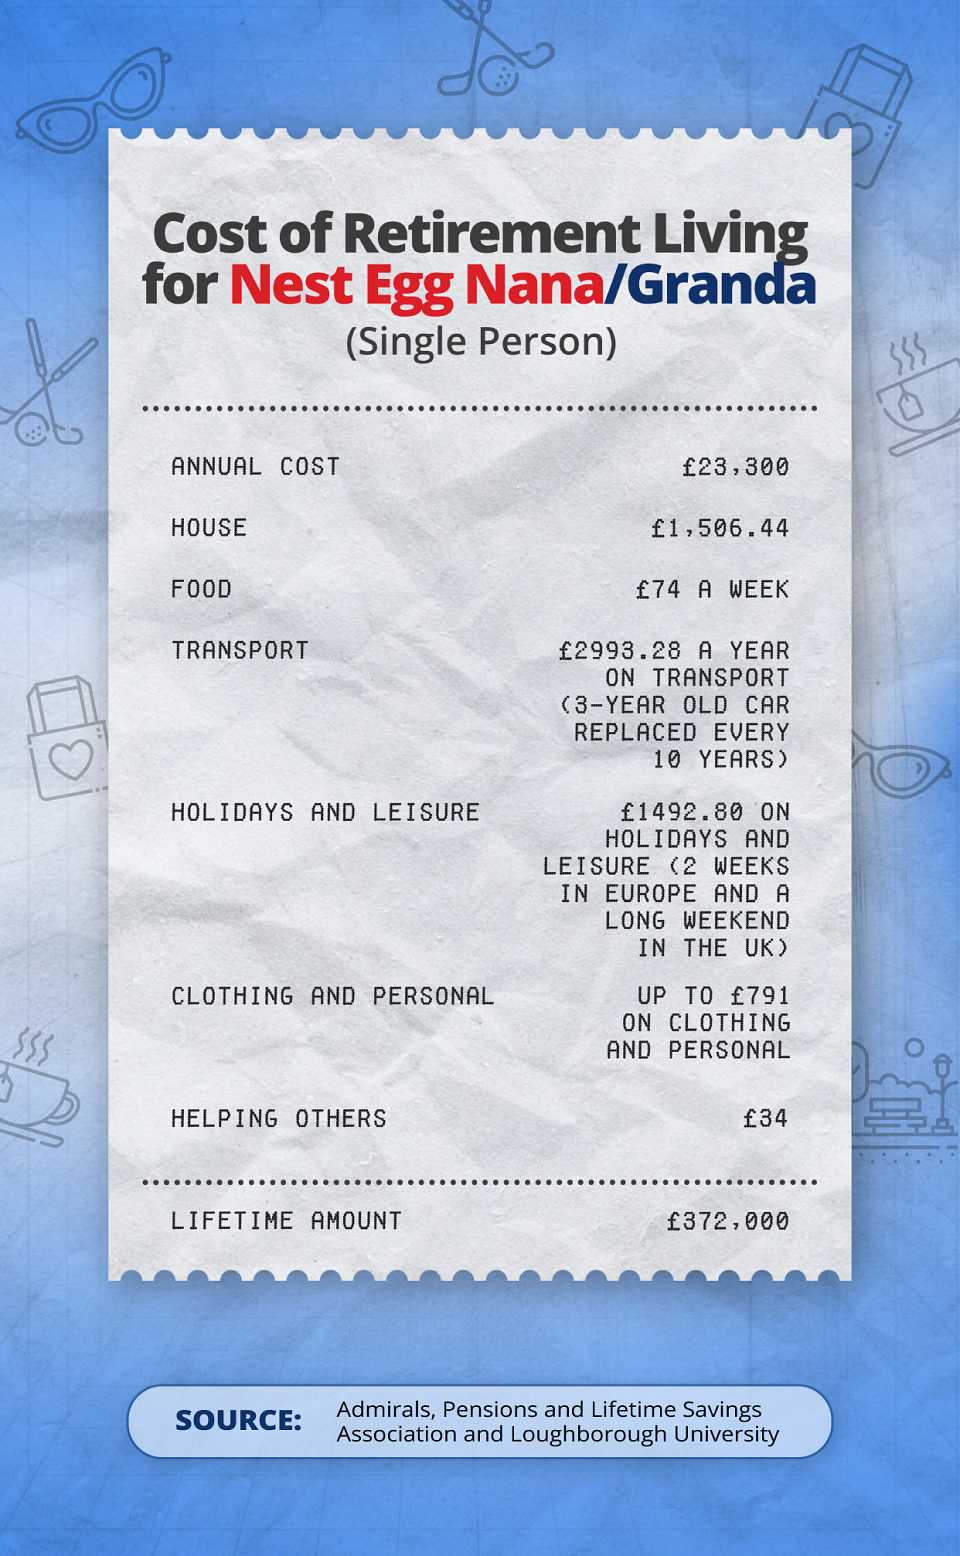
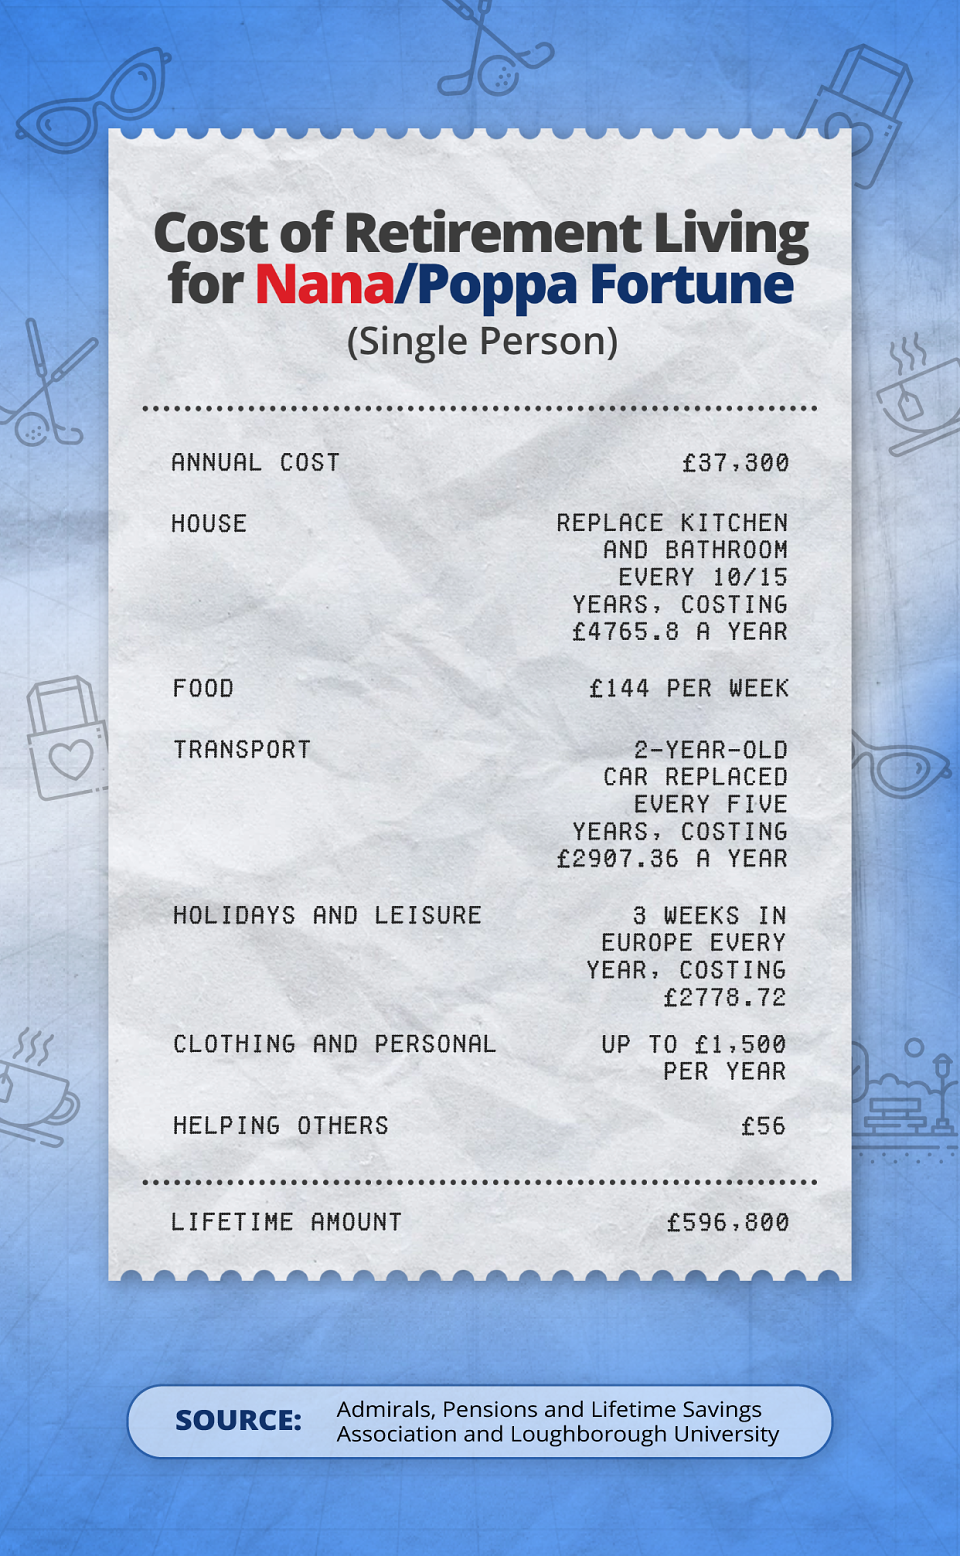
Infographic 1: Which Retirement Lifestyle Can You Afford?
The goal of this project is to create a set of receipt style infographics that show the breakdown of expenses for each category for a single person. The infographics will be used on a website that helps people manage their finances. It should have a realistic and appealing look, as if they were actual receipts that someone had used and kept.The infographics should be responsive and adaptable to different screen sizes. For desktop, the infographics should be displayed as three receipts in one graphic, with each receipt showing a different category. For mobile, the infographics should be displayed as three separate graphics, with each graphic showing a single receipt. The categories are: food, entertainment, and utilities.
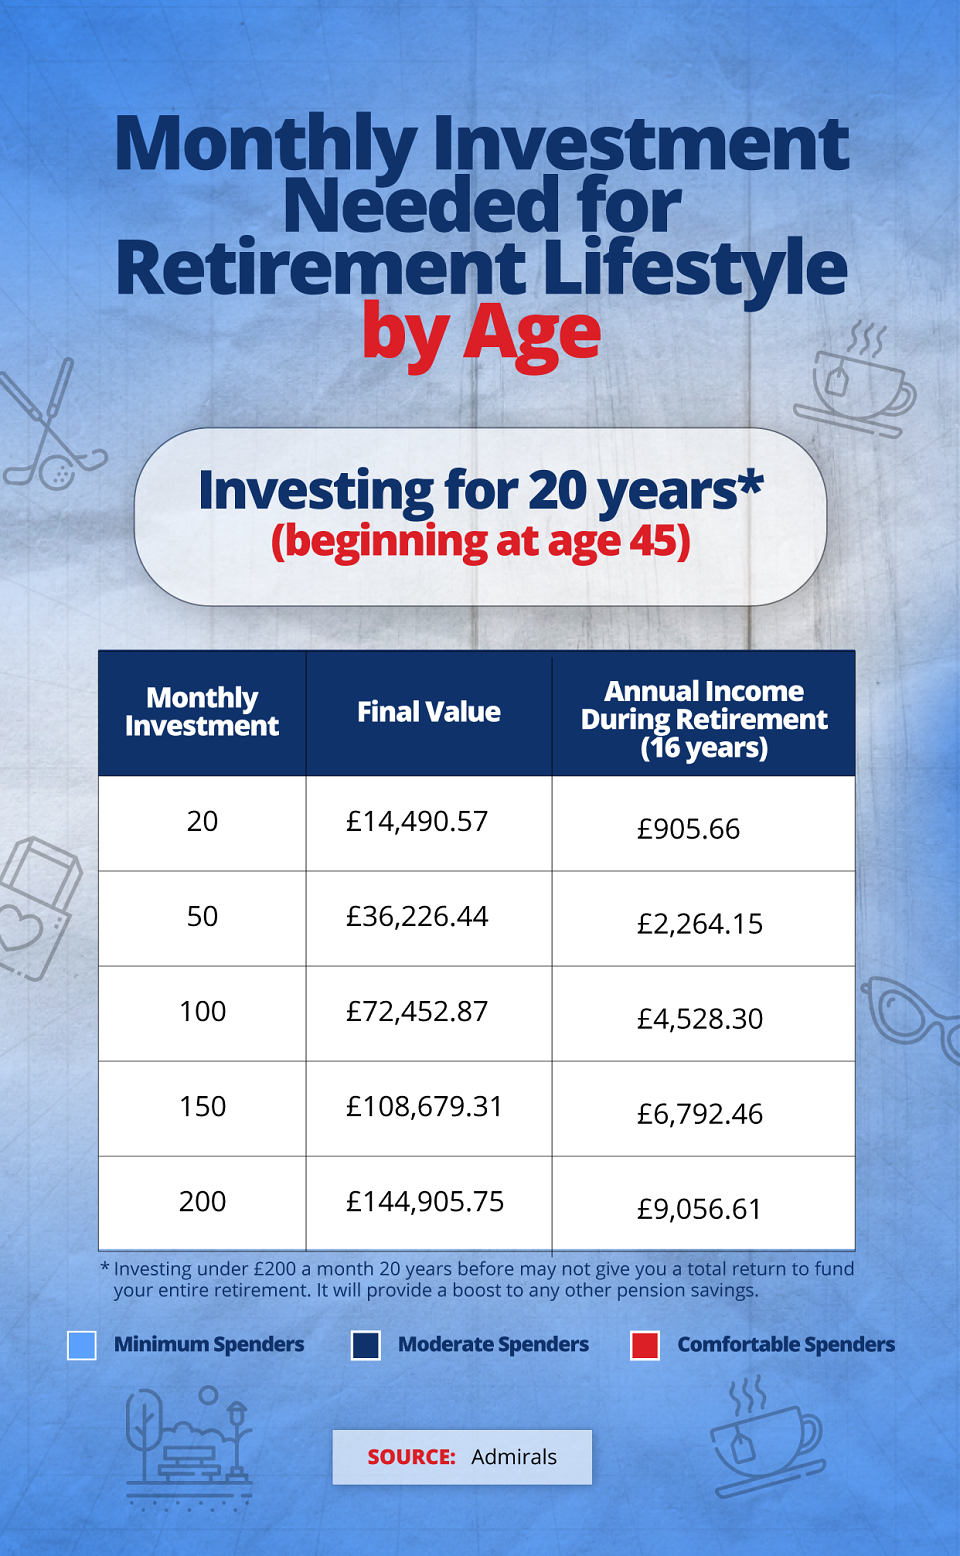
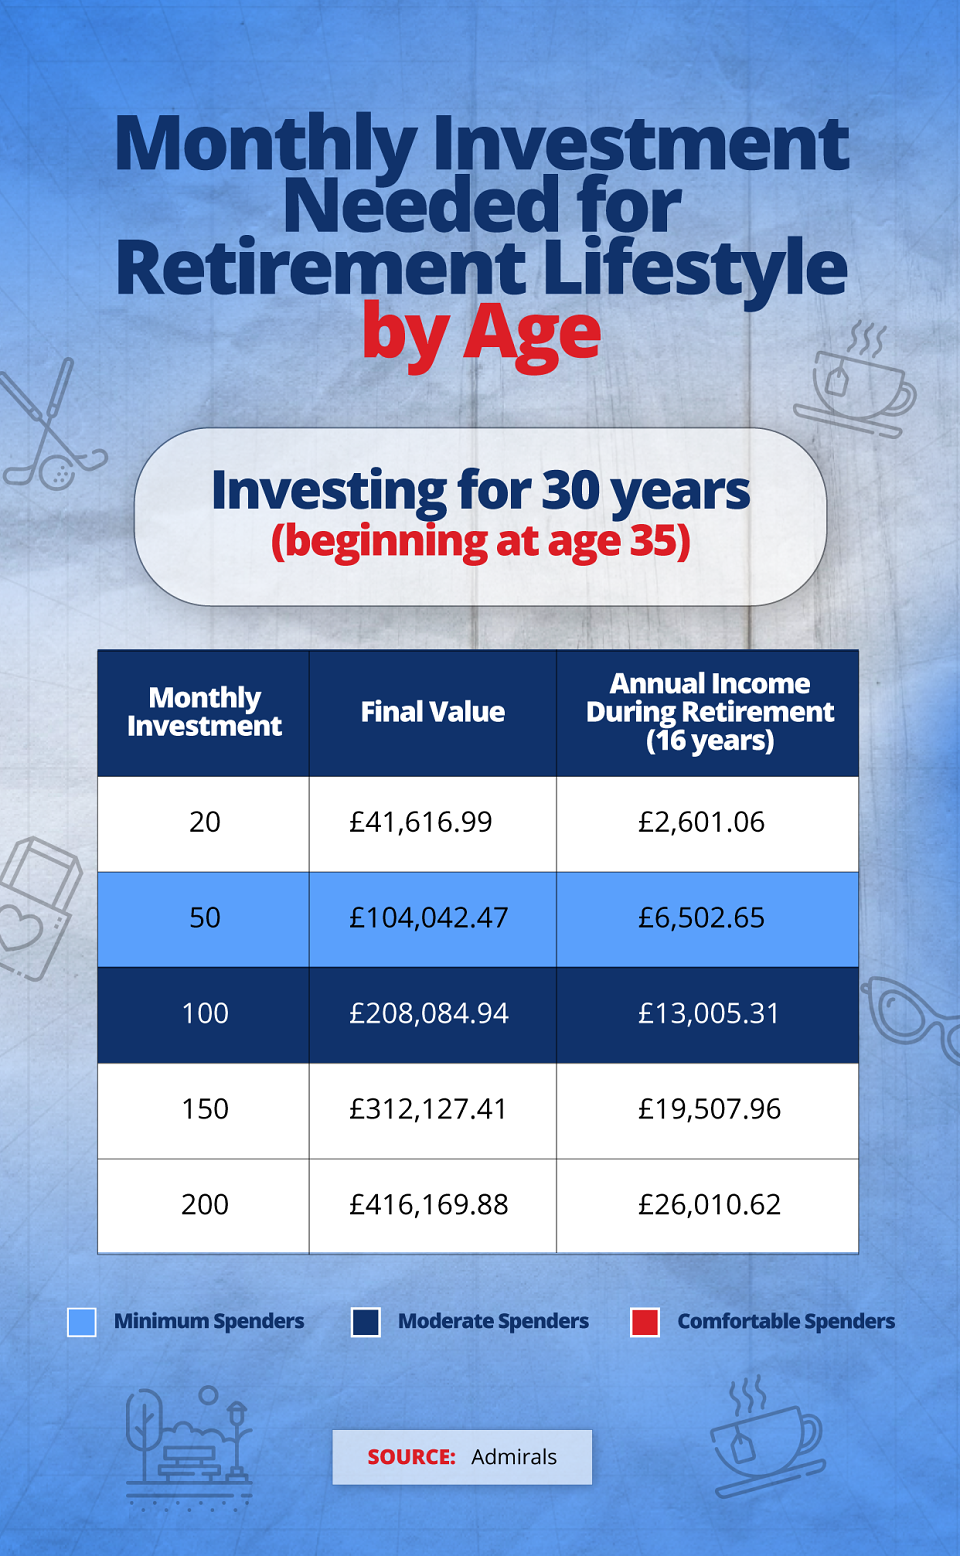
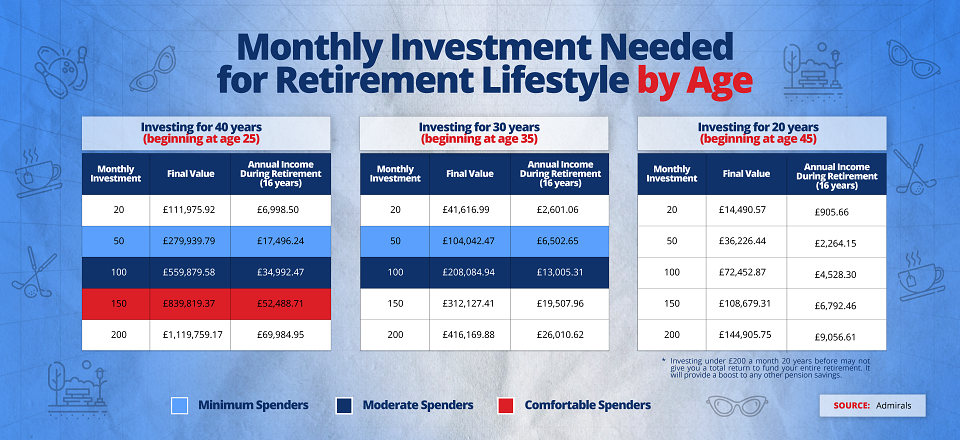
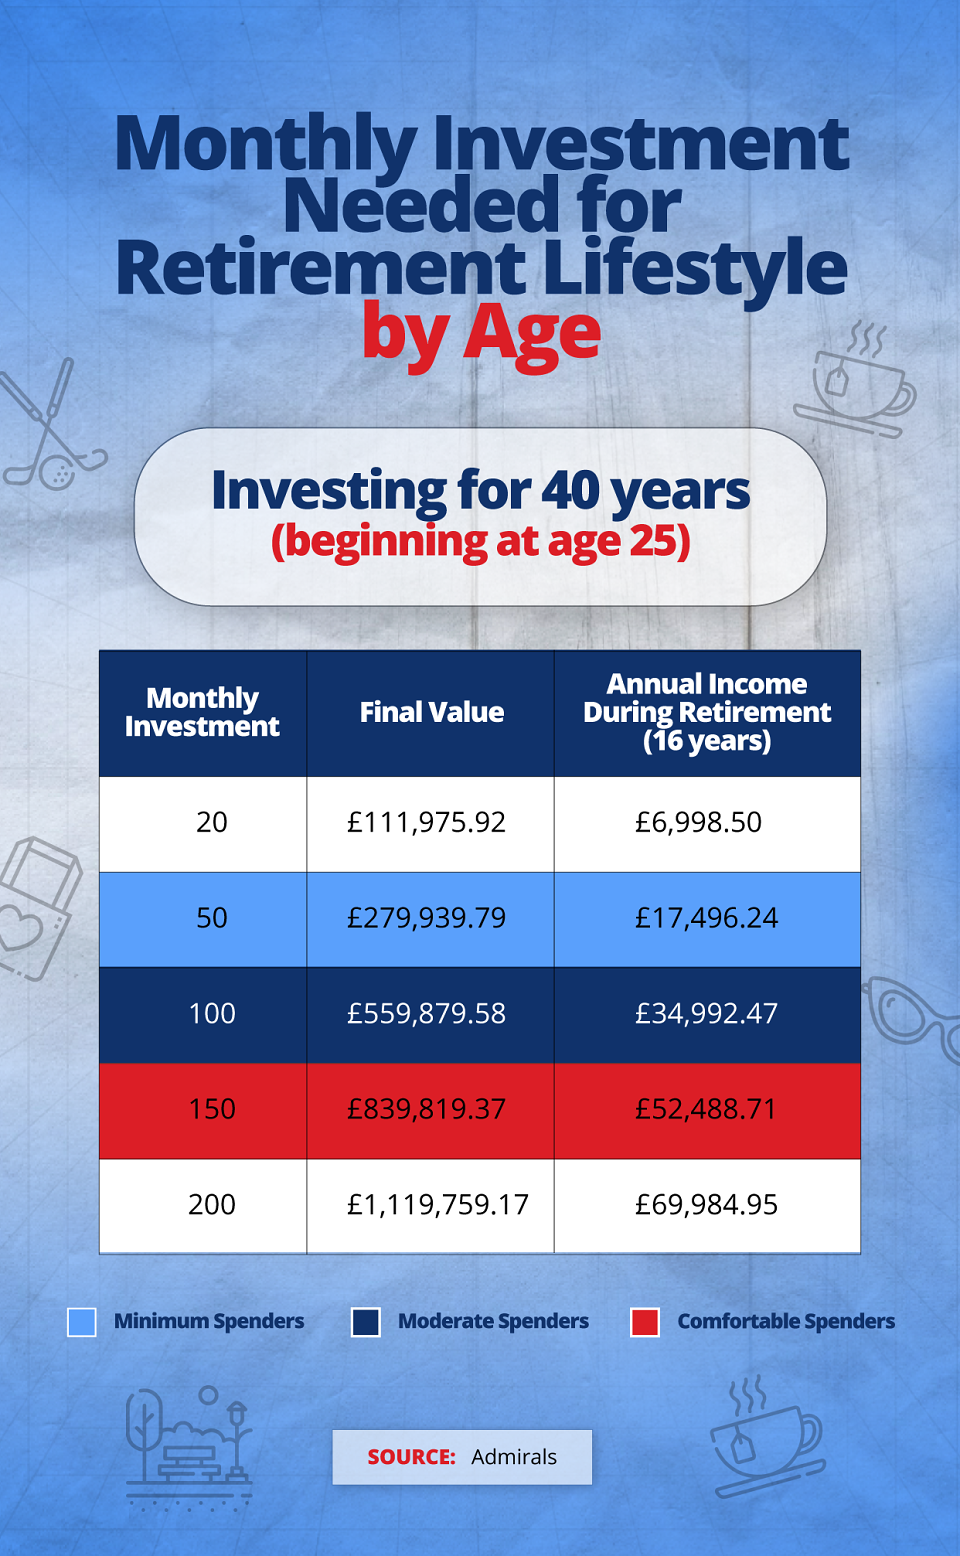
Infographic 2: Monthly Investment Needed for Retirement Investment Lifestyle by Age
This goal of this project is to create a series of tables that show the monthly investment required for different retirement lifestyles by age. Each table will correspond to a persona that represents a typical spending pattern, such as frugal spender, moderate spender, or lavish spender. The tables will also use colour coding and a key to highlight the persona that matches the investment amount.