Piyush Bhaakhariya
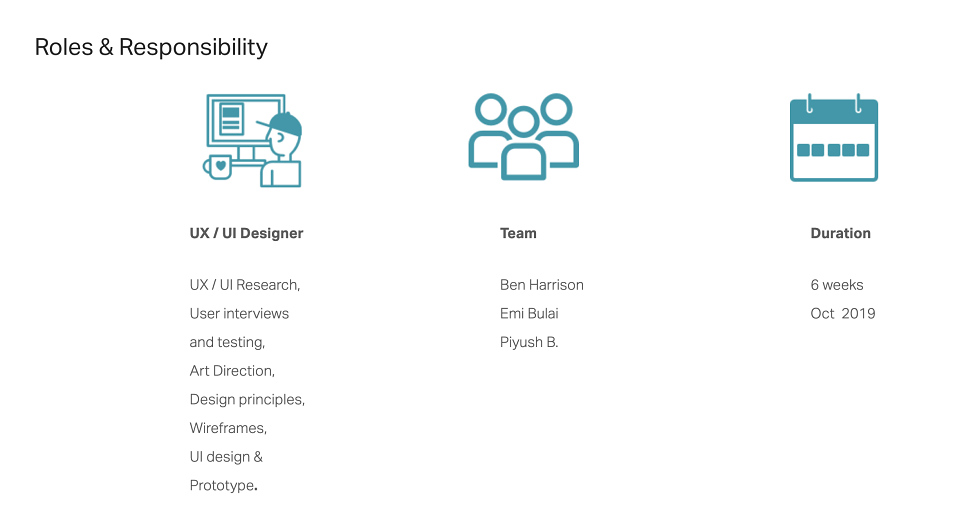
UX /UI Designer
ABOUT
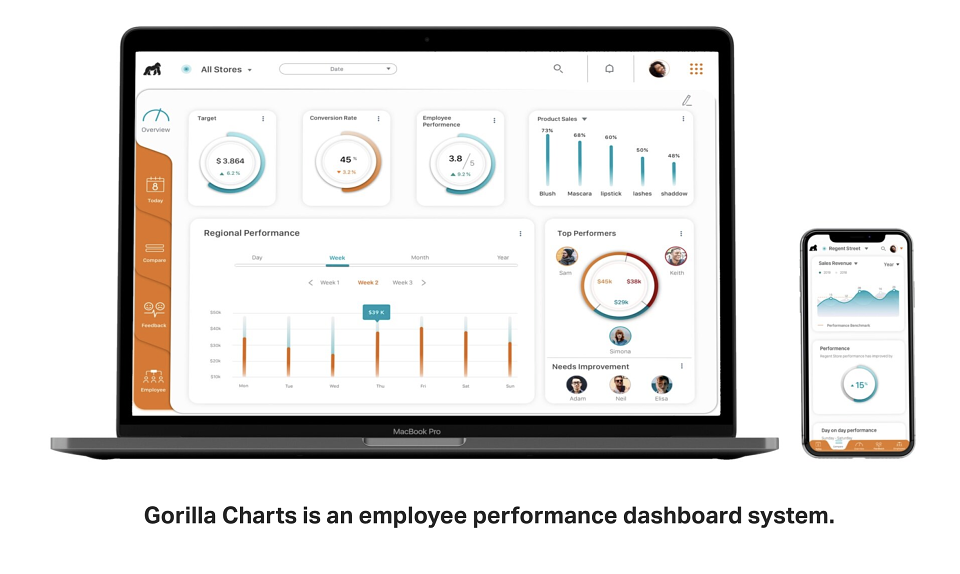
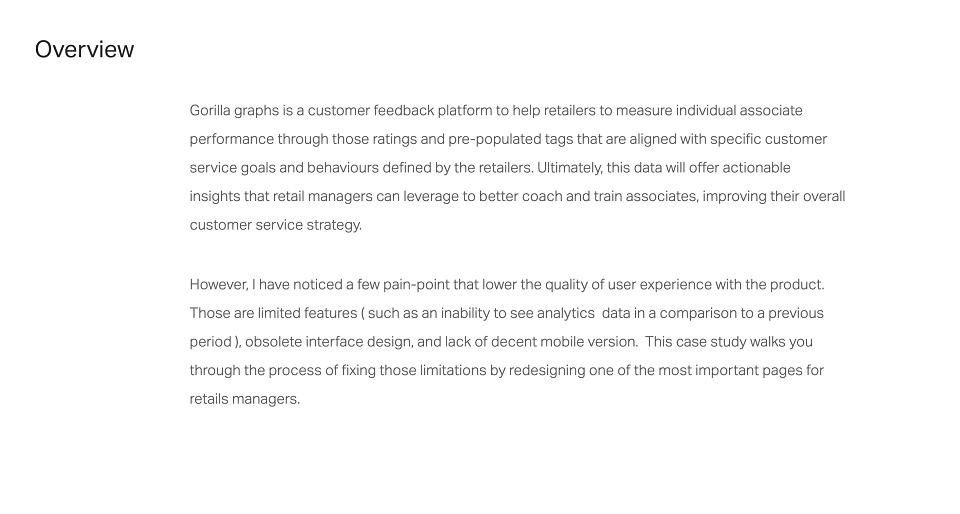
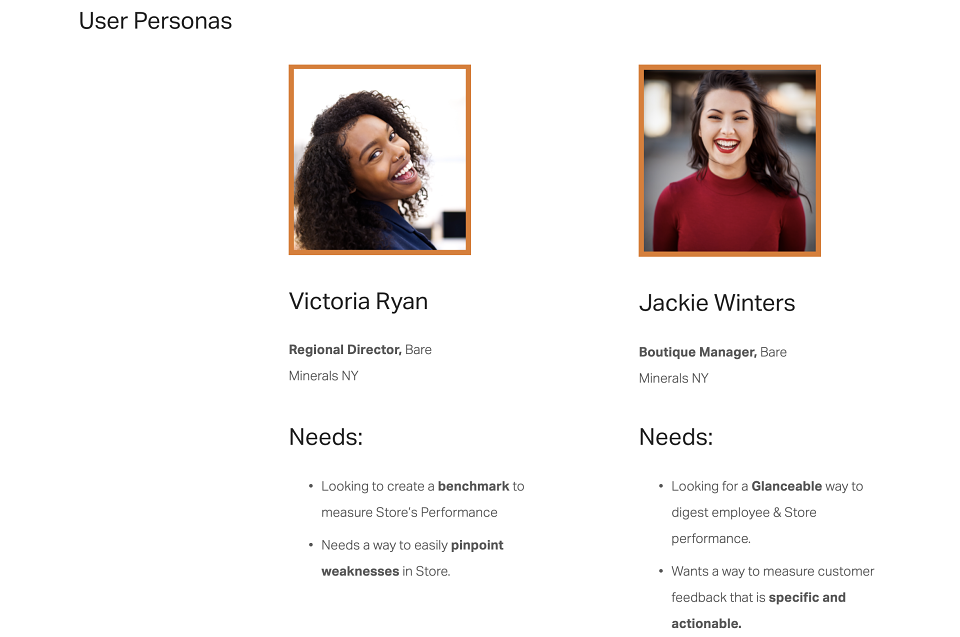
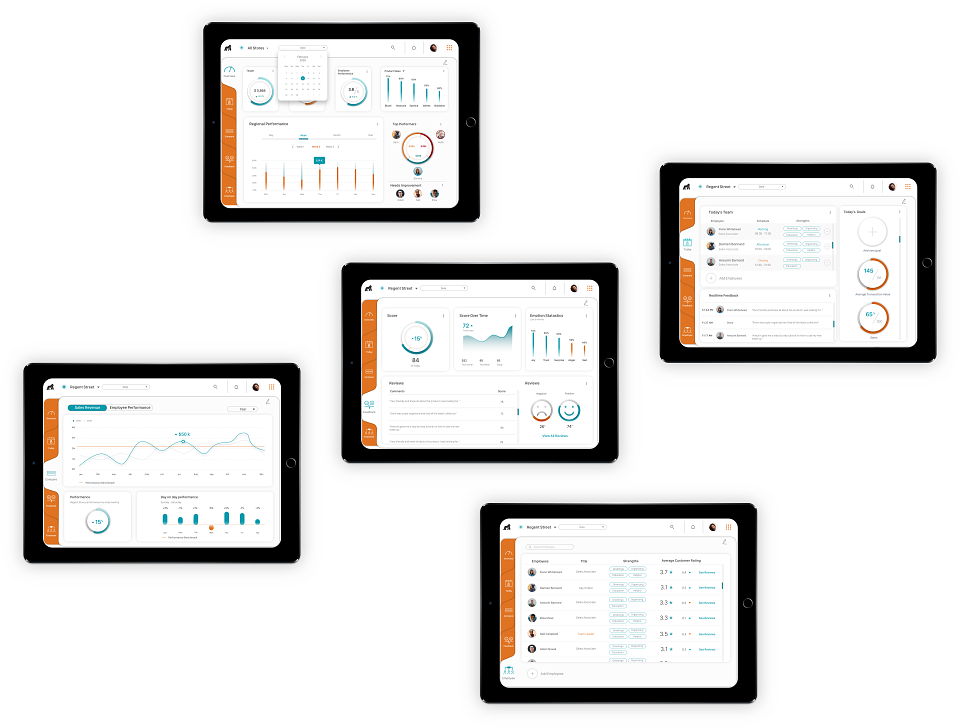
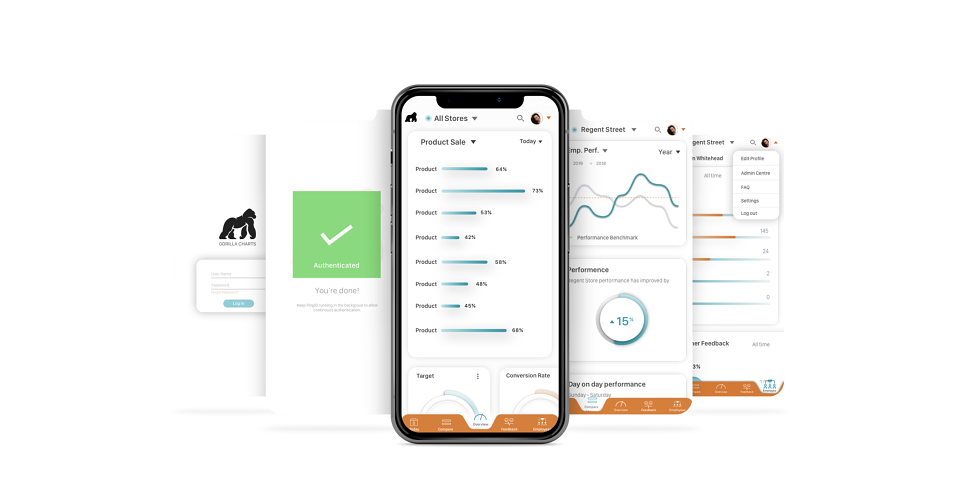
Gorilla graphs is a customer feedback platform to help retailers to measure individual associate performance through those ratings and pre-populated tags that are aligned with specific customer service goals and behaviours defined by the retailers. Ultimately, this data will offer actionable insights that retail managers can leverage to better coach and train associates, improving their overall customer service strategy.
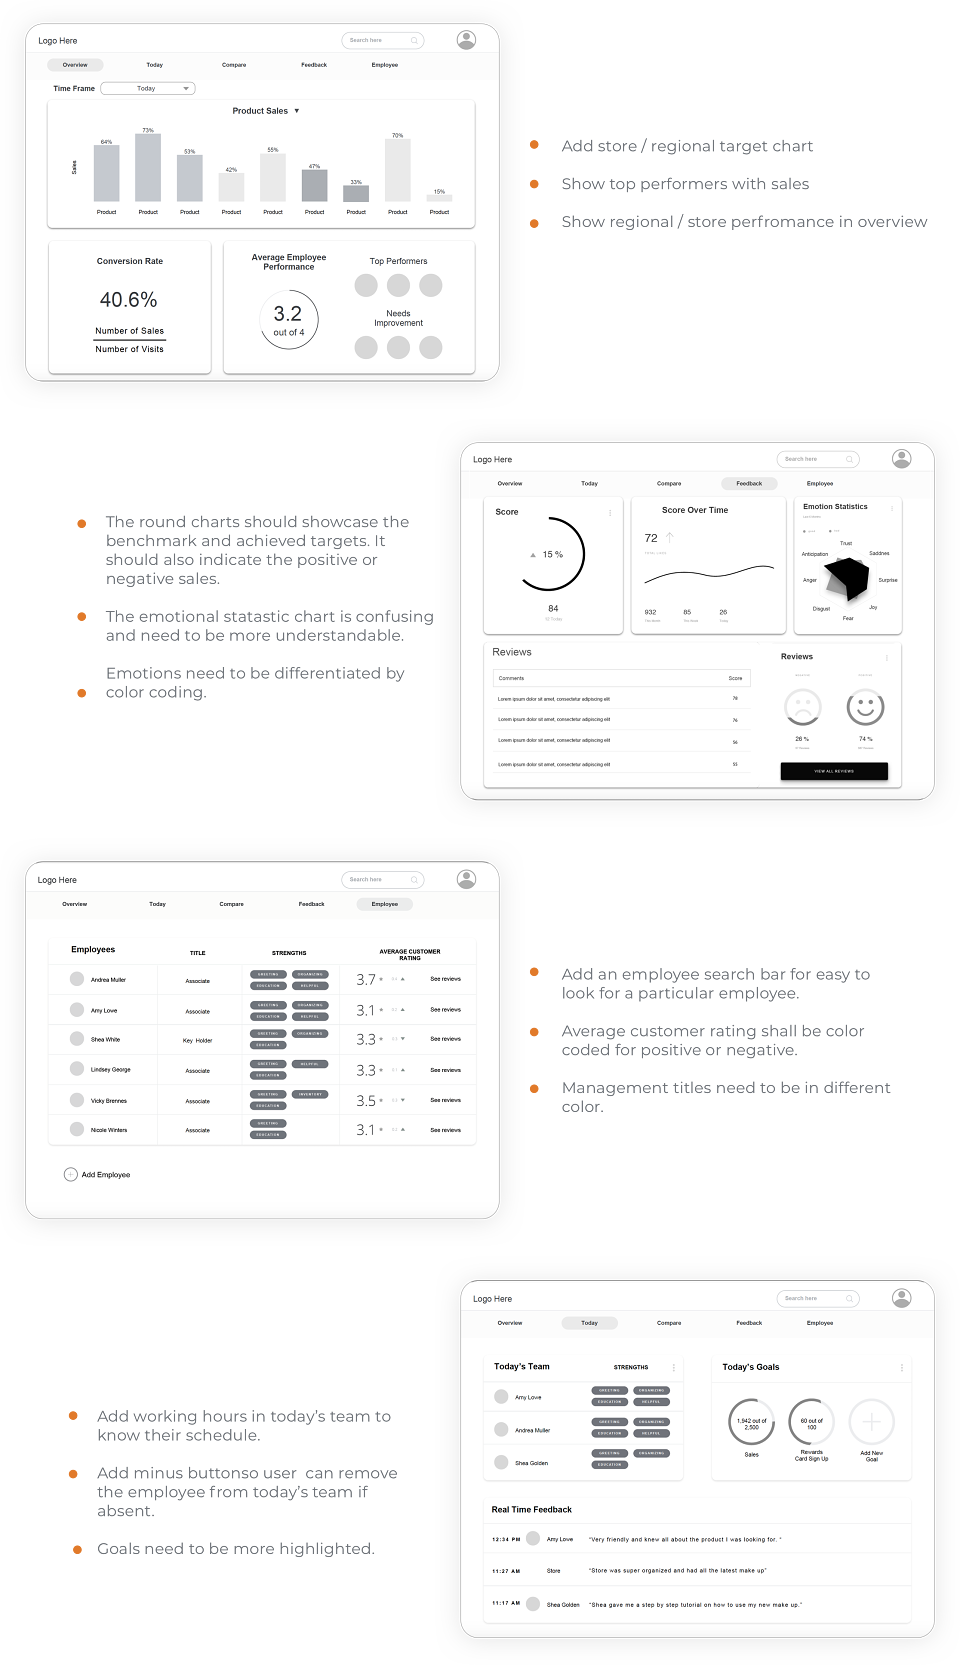
However, I have noticed a few pain-point that lower the quality of user experience with the product. Those are limited features ( such as an inability to see analytics data in comparison to a previous period ), obsolete interface design, and lack of decent mobile version. This case study walks you through the process of fixing those limitations by redesigning one of the most important pages for retails managers.