Marko Kovacevic
Graphic Designer
ABOUT
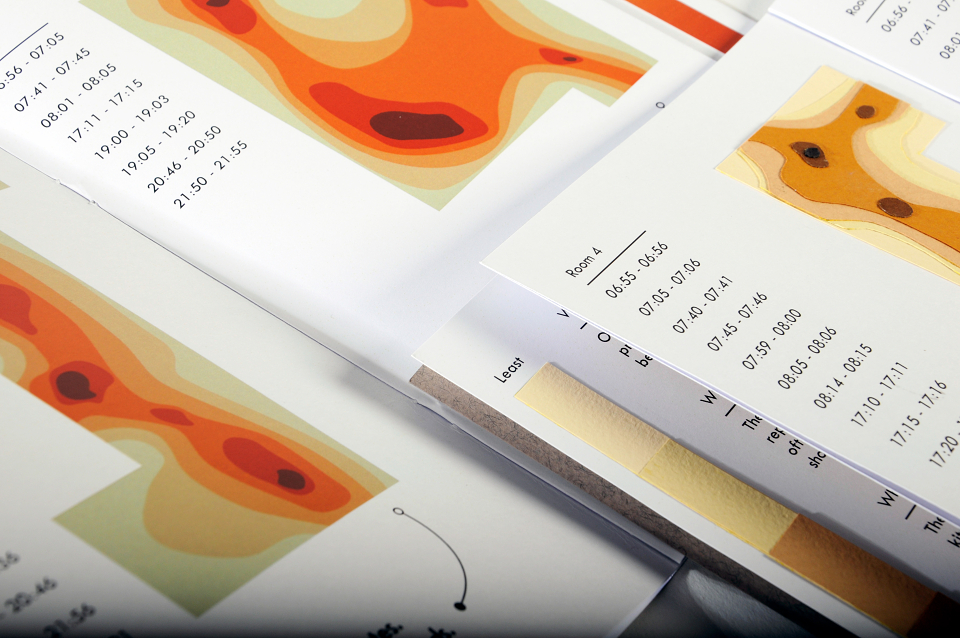
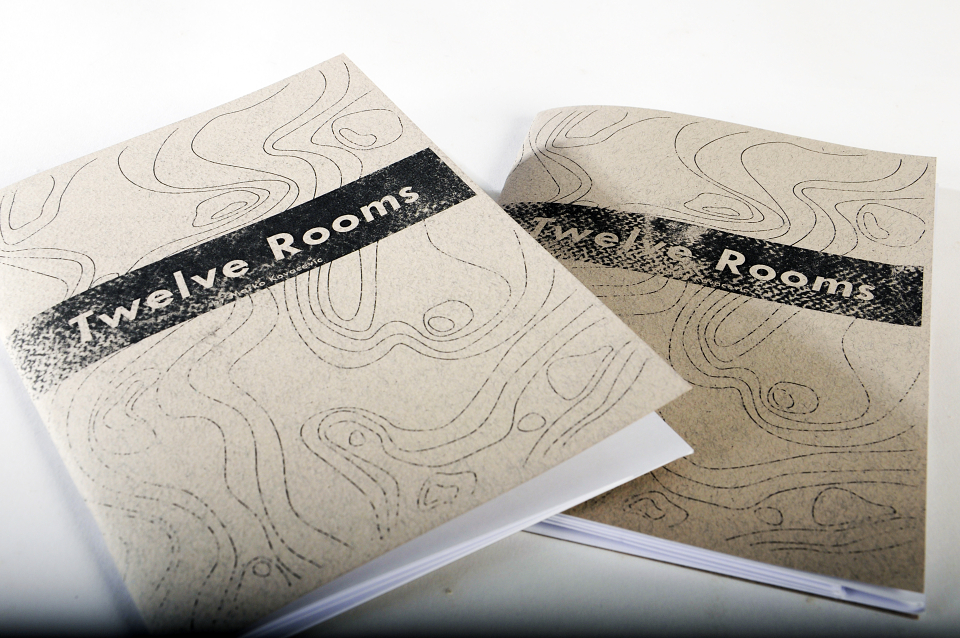
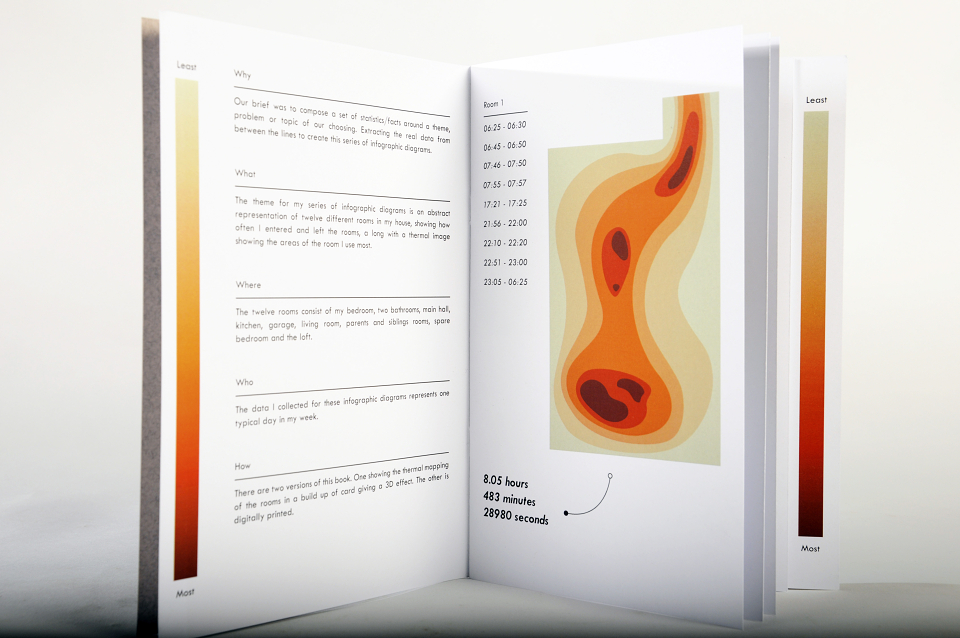
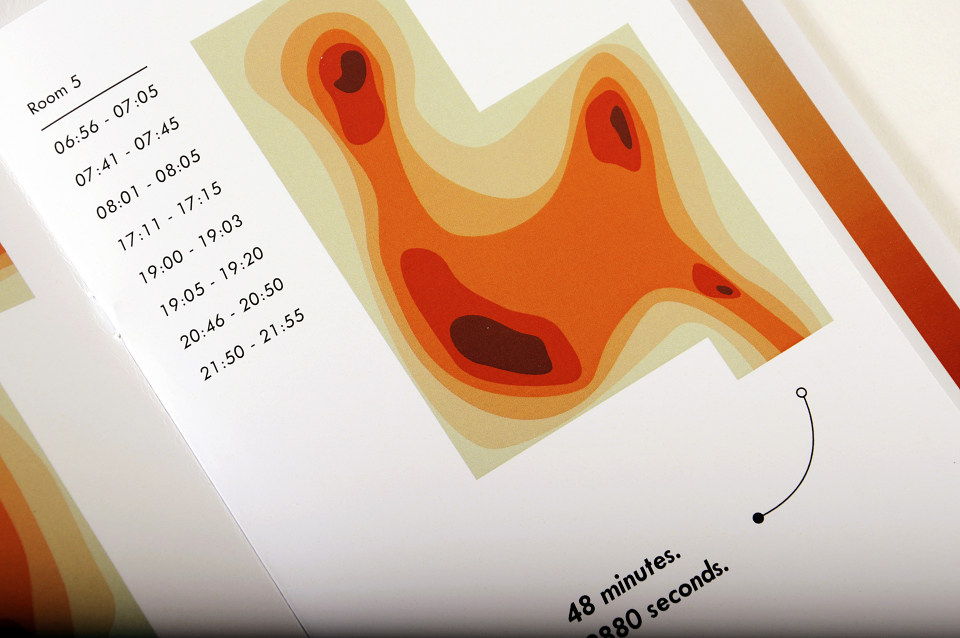
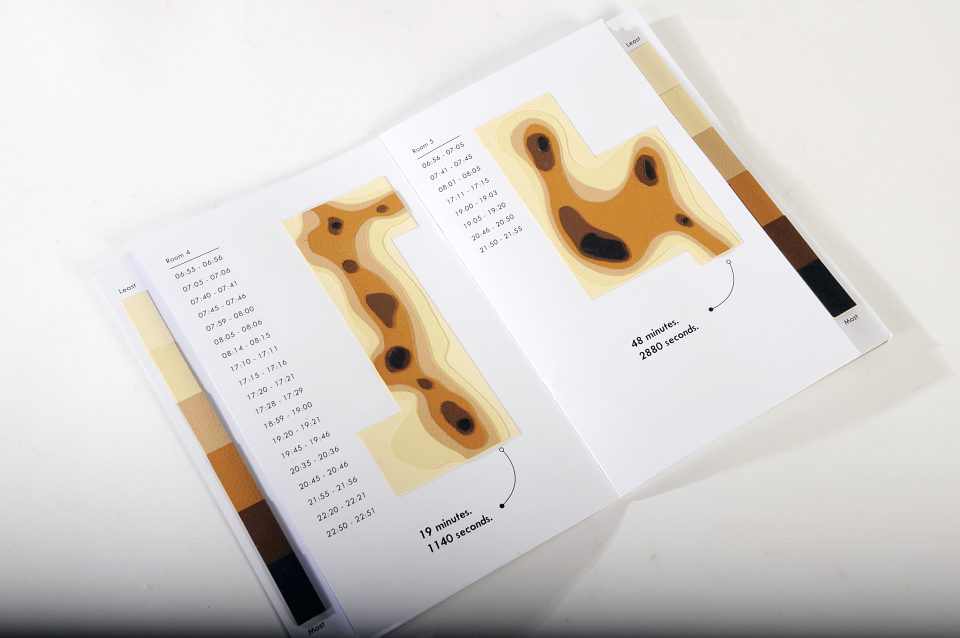
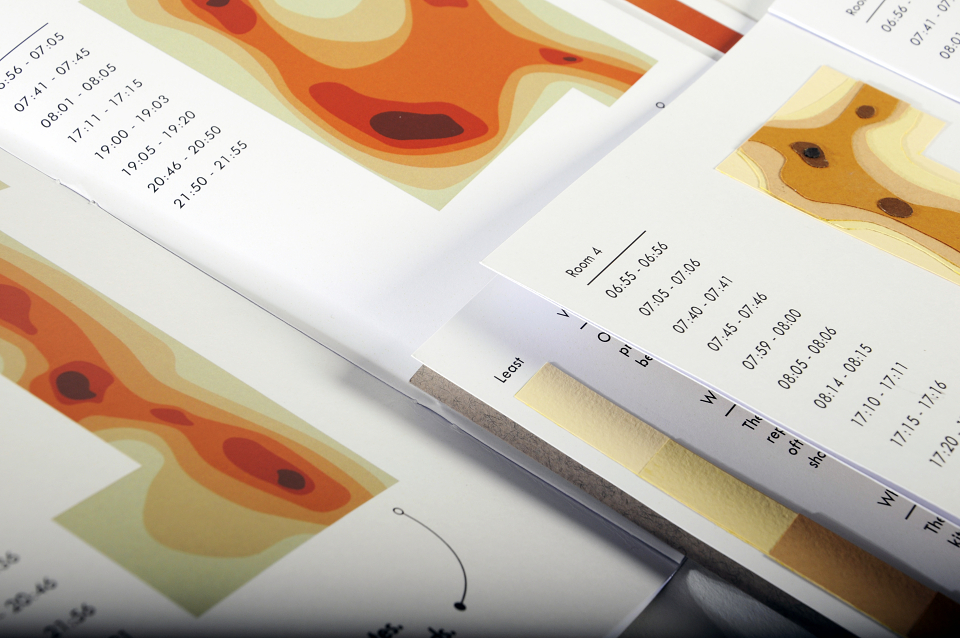
For this project I created two booklets, one printed digitally, the other hand made. These contained a set of info-graphics on my chosen topic. I chose to document the amount of time I spend in twelve rooms of my house. I visually represented this in the form of a heat map, that shows the area in each room I spend most time in on an average day.
MADEIT CREDITS
-

Marko KovacevicGraphic Designer