Maia James
Multimedia Designer
ABOUT
Security is a very prominent concern for people in the northern suburbs of Johannesburg and something that is on people’s minds a lot of the time. Because security is such a major issue it is of interest to people to get a bigger picture of the security measures that people take to make them feel safer so that people can see the bigger picture when it comes to security. This would also help people in improving or changing their security measures depending on the areas that they live in.
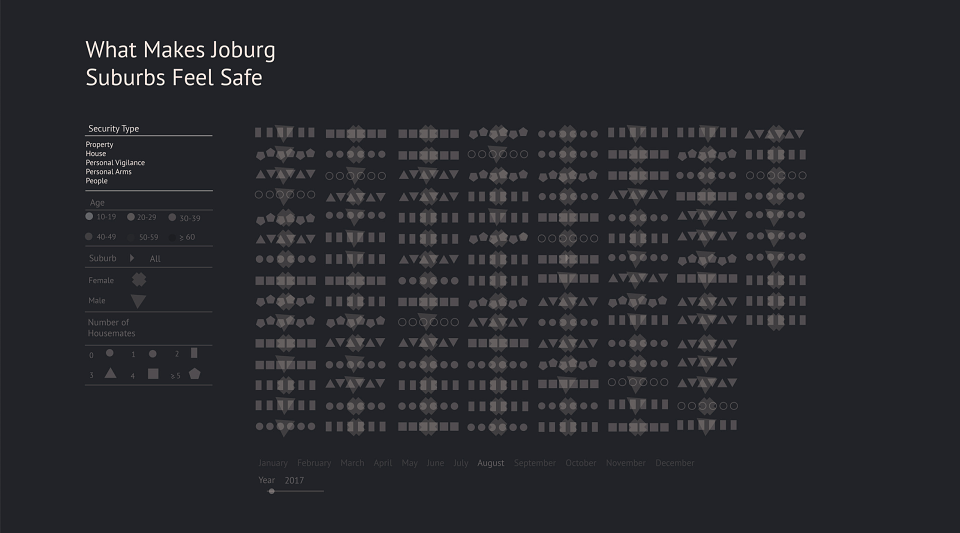
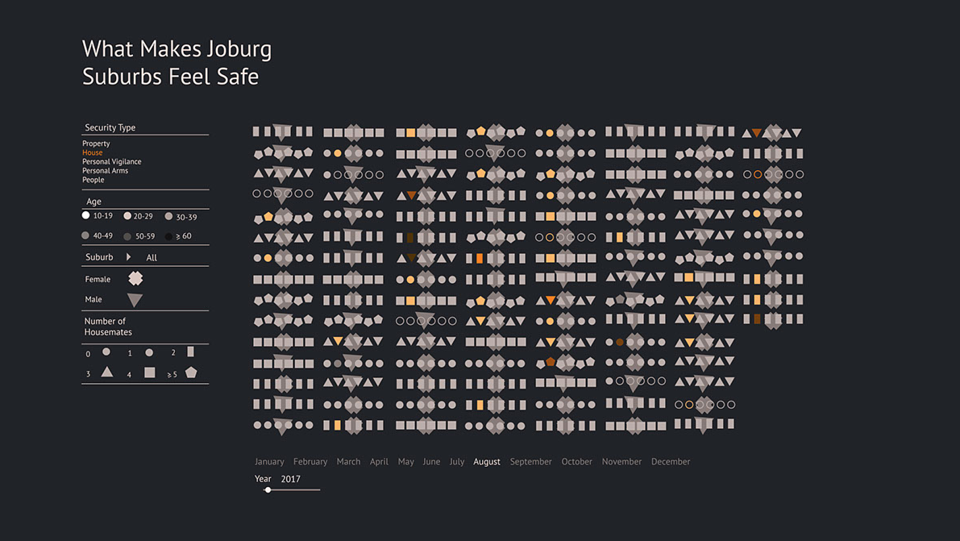
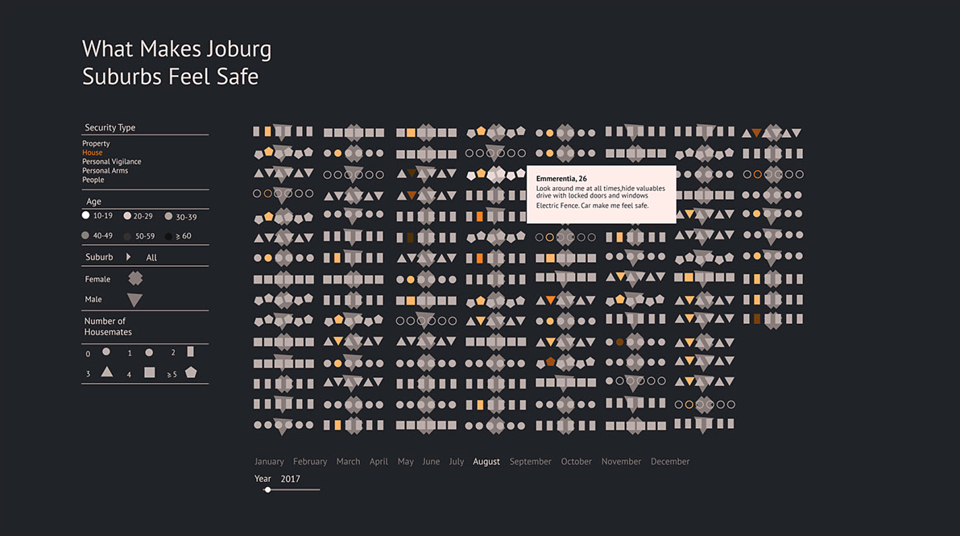
This project is design for people who are unfamiliar with living in Johannesburg. I so that the user can see the number of people that use each type of security measure to feel safe in the suburbs of Johannesburg as a whole and within each suburb. This data visualisation allows the user to arrange the data in a number of different ways and make a number of different comparisons. People can also look at individual instances and see what combination of security measures they use and what they find most effective. Each questionnaire is represented on the graph in order of the time that they answered and the user can click on each answer and the user can see the exact time in which they answered. By including a time element to the Data Visualisation one is able to see security measures that become most important in people’s lives at specific times of the year for example around news years and Easter people may be more worried about driving safety then other parts of the year.
MADEIT CREDITS
-

Greenside Design Center ProjectClient
-
Maia JamesResearcher and Graphic Designer