Fuselab Creative
McLean, VA
ABOUT
Concept
A new way to see data.
Conversation meets visualization so complex, layered information becomes intuitive, explorable, and alive.
You ask a question; the system builds the view. Dashboards appear, update, and reshape as you think - a dialogue between human and data.
Execution
Design intent: Turn abstract analysis into something you can see and feel - an interface that explains itself, reveals relationships, and makes comparison effortless.
Three key scenes
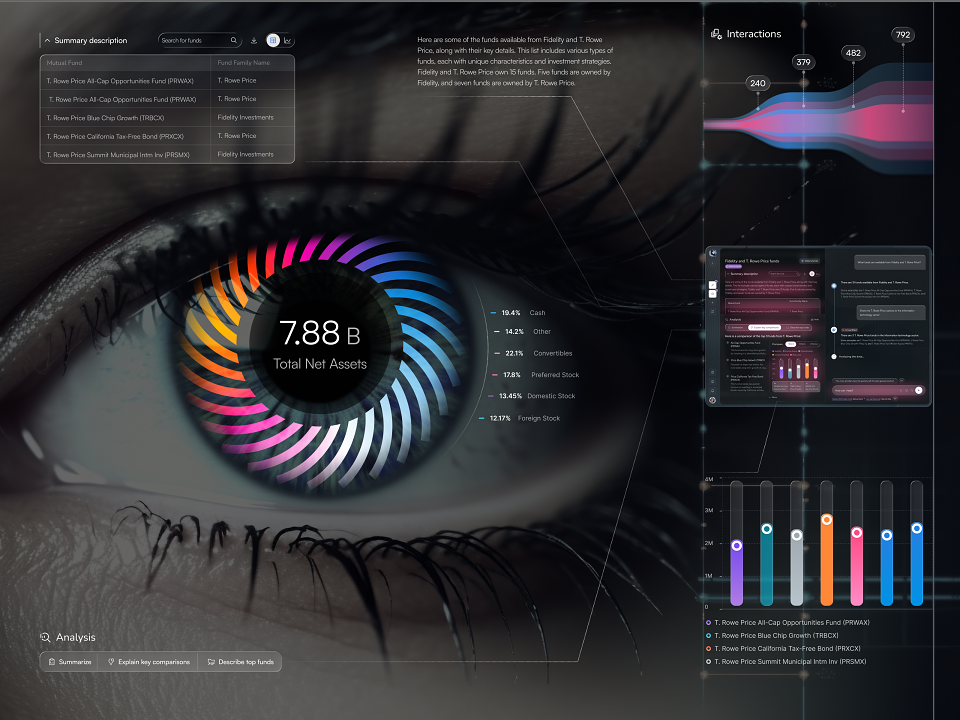
The Research View: A smart assistant answers financial questions, compares funds, and visualizes key metrics side-by-side.
The Insight Layer: A visual metaphor for perception - the “eye” that sees the data; flows and rings map structure and value.
The Workspace: A personal hub with pinned insights, activity metrics, and team threads - built for people who live in data.
Results
Clarity on demand: Questions become views in seconds.
Thinking made visual: Not just static charts, but a space for exploration and understanding.
Human, immediate, beautiful: Design turns complex systems into insight.
Because clarity is intelligence - and the right interface makes it feel effortless.