Alan Owen
Graphic Designer
ABOUT
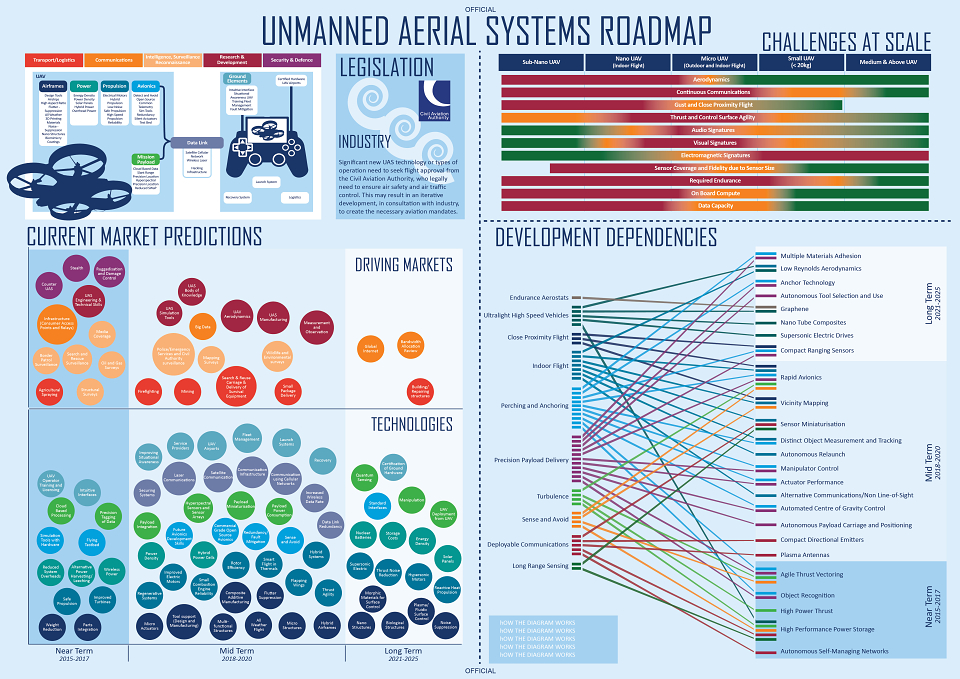
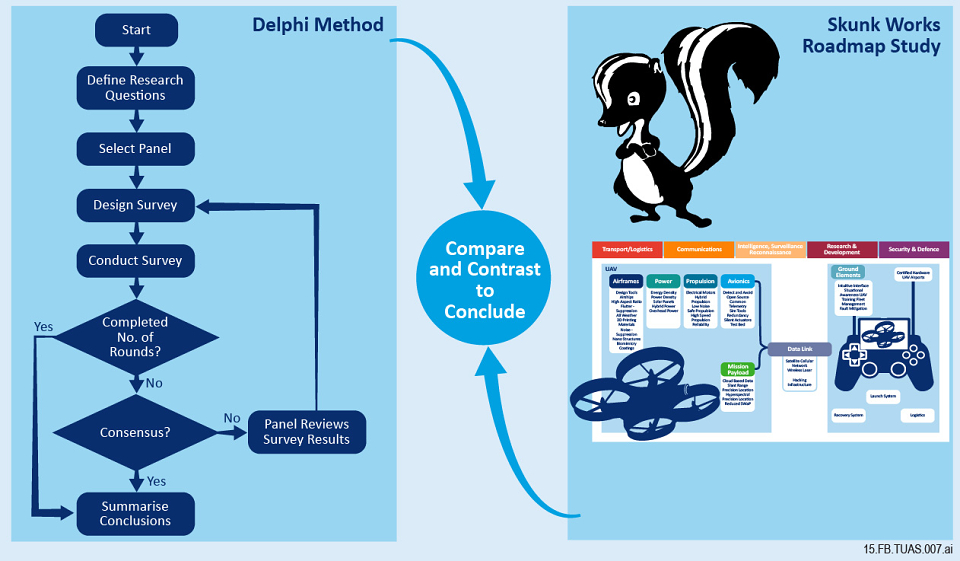
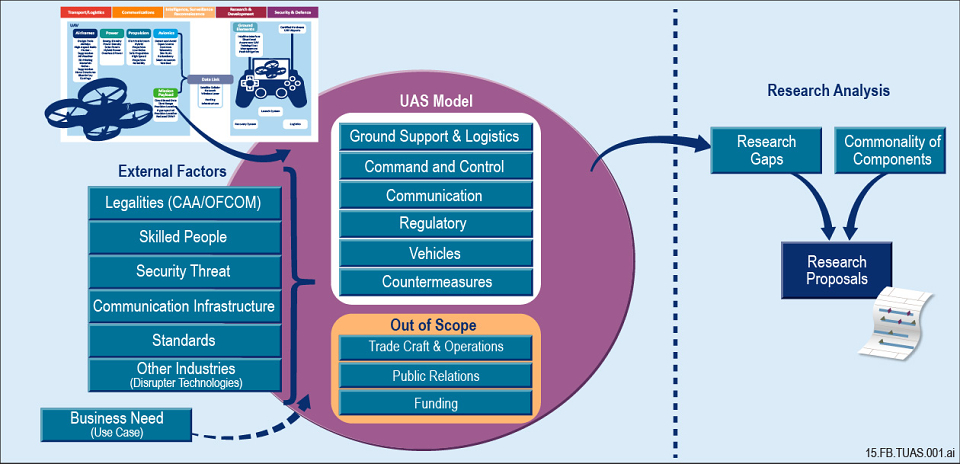
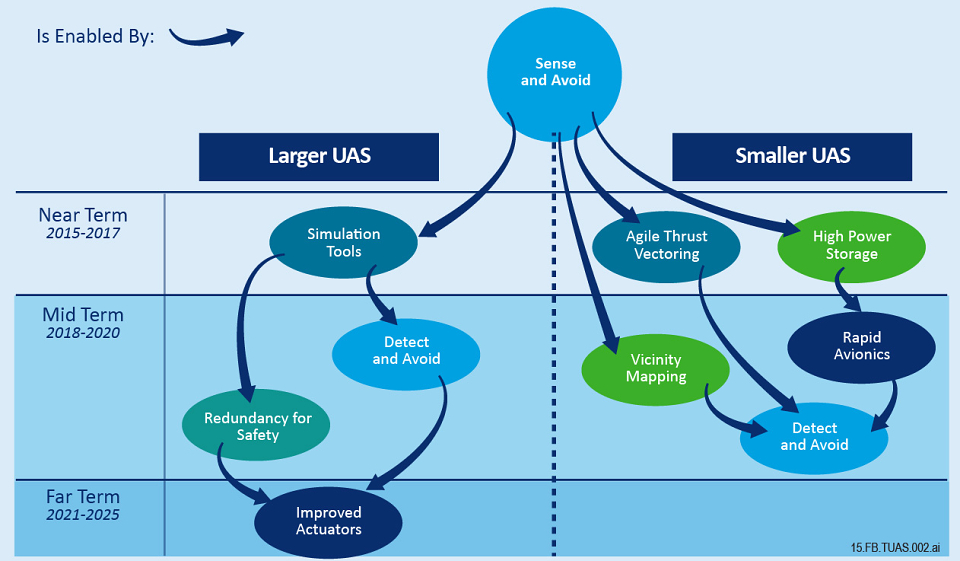
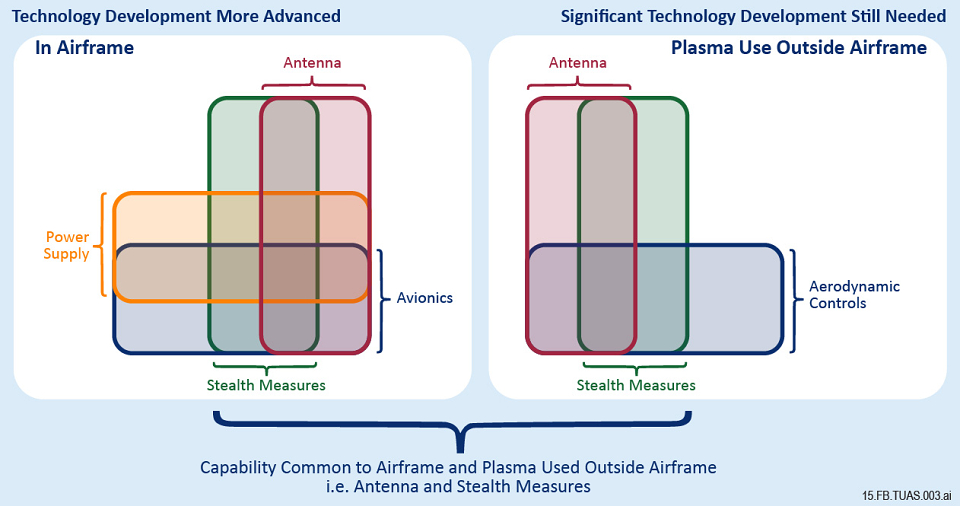
Create infographics for a white paper showing the risks of UAVs near airports now and in the future..
The information and data was given to me by the subject matter experts to see how I could make the information easily to understand. Once the images where created for the white paper the next stage was to create the poster. The bubble chart was created using data from an Excel spreadsheet and the other parts of the diagram drawn up by hand.
The poster was well received and printed out at A0 size and everything was produced in Adobe Illustrator. I believe the poster is being used the the customers offices.